

Reports, profitability and CO₂
The monthly overview, custom reports, profitability per vehicle, driver, customer and route, trip result, empty running, performance and the CO₂ report.
Reports has these tabs: Overview, Profitability, Trip result, Empty running, Performance and CO₂. On every page, Explanation of these figures explains how the figures are calculated.
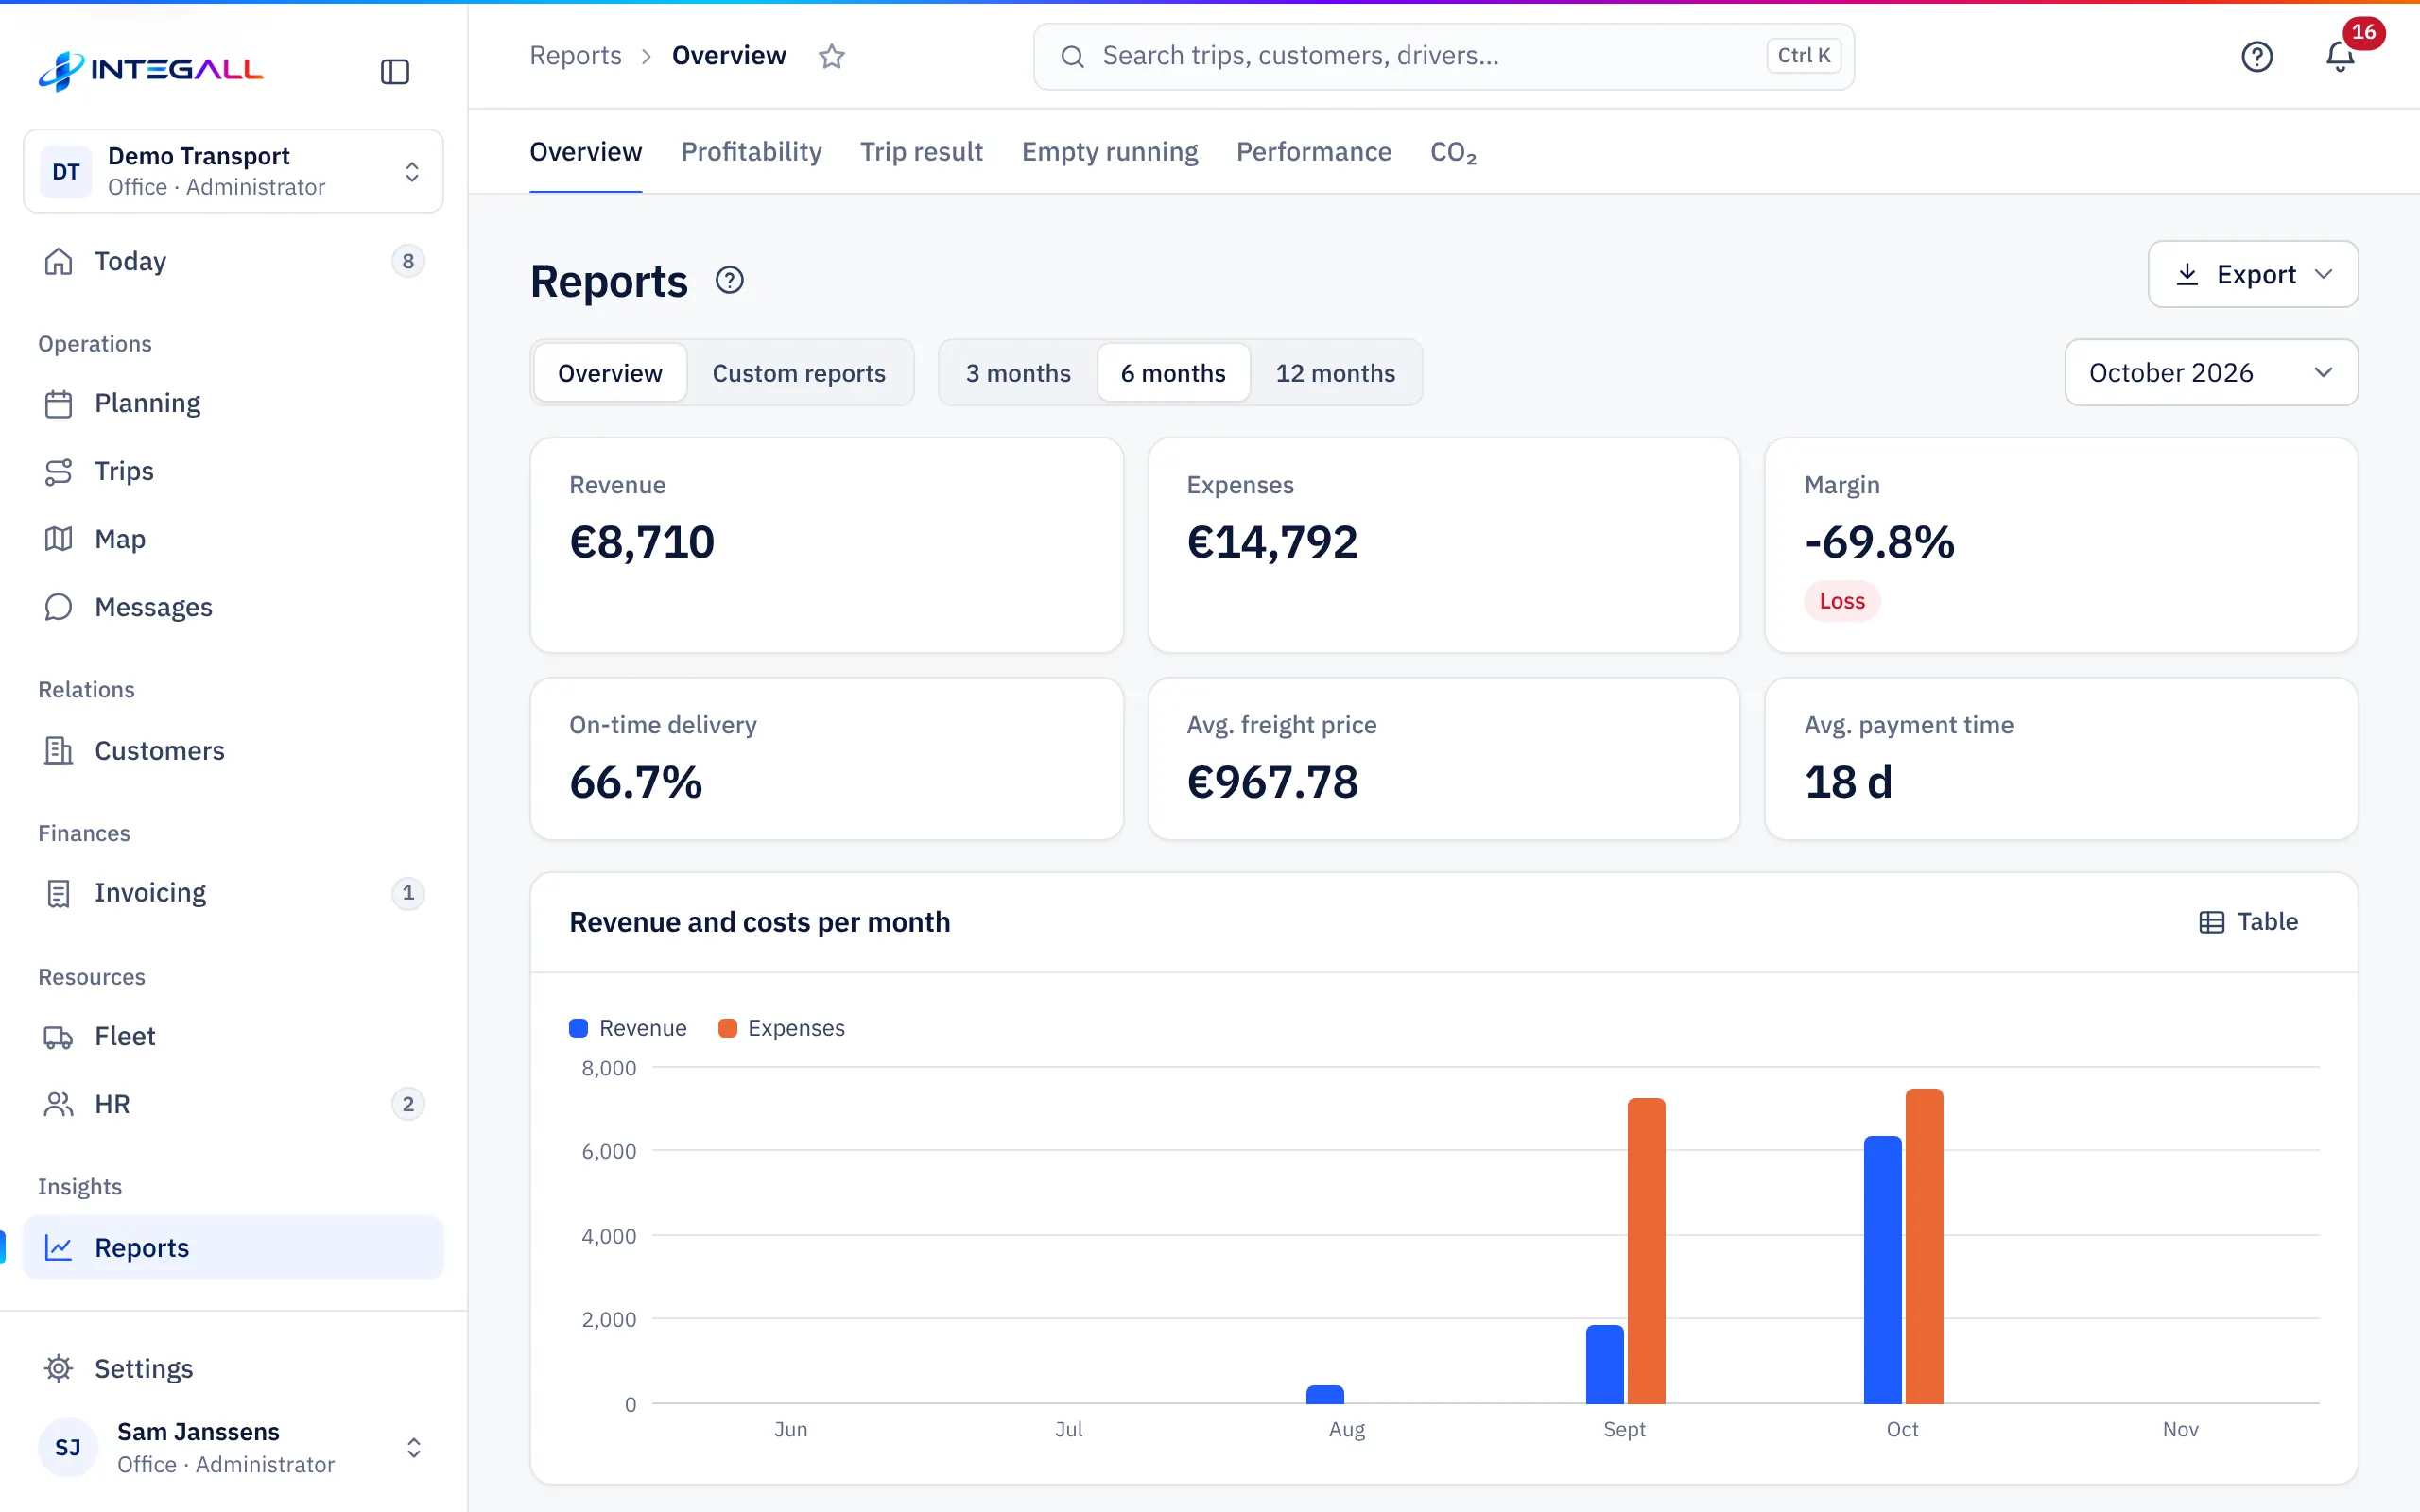
Overview#
Choose 3, 6 or 12 months. You see among other things: Revenue and costs per month, Cost breakdown, Margin per month, Diesel price per litre, Open invoices by age, Revenue per customer (also per month), Price per km, Busyness per weekday · 12 weeks, Top routes, the quarter's VAT overview, and tables per driver and per vehicle.
Revenue is the freight price of delivered trips (excl. VAT). Costs are expenses and purchase invoices excl. VAT, gross wages, subsistence allowances and fines paid by the company, without employer contributions.
Under Export you find the Monthly report (PDF): one PDF with revenue, margin, invoicing, customers, costs, fleet and drivers, handy for yourself, your accountant or the bank.
Custom reports#
Under Custom reports you choose a report, adjust filters and period and choose Save as report. Saved reports are listed and can be shared and scheduled. Recipients get a notification; they only see the figures after signing in, with their own permissions. Scheduled reports contain no figures in e-mails.
Profitability#
Profitability shows revenue, costs and margin per vehicle, driver, customer, subcontractor and route. Tabs: Vehicles, Drivers, Customers, Subcontractors, Routes, Profit and cash flow, Trips, Compare, Budget and Fixed costs. Choose the period (This month, 3, 6 or 12 months, This year) and save a view with Save view. Export gives Excel or PDF.
- Vehicles: per vehicle Trips, Km, Revenue, Fuel, Service, Other costs, Damage, Margin, Cost/km and Revenue/km.
- Profit and cash flow: profit and cash flow from final invoices, purchase invoices and all costs, reconciled per period.
- Trips: per trip the revenue minus fuel, toll, other costs, subcontractor, daily driver cost and fixed vehicle costs. Red trips make a loss.
- Compare: two periods side by side, with the difference in euros and percent.
- Budget: monthly targets for revenue and result, next to what you actually achieved.
- Fixed costs: leasing, insurance and tax per vehicle, and the daily cost of a driver. These figures are spread over the trips.
Fuel and toll not linked to a trip are spread over that vehicle's trips in that month according to the km.
Trip result#
Trip result compares planned with actual per trip: kilometres and time from GPS, revenue, costs and waiting time. Every amount shows where it comes from. Tabs: Action points (what needs attention now, with a suggested action; nothing is changed automatically), In transit, Driving times, Odometer, Refuel, Trips, Waiting time and Settings.
Waiting time: time at a loading or unloading address longer than the free time, measured with GPS. You accept or reject the waiting time; accepted waiting time is added automatically as a line on the trip's draft invoice. A final invoice is never changed.
Empty running#
Empty running shows how many kilometres your trucks drive without cargo: from the unloading place of one trip to the loading place of the next. Distances are straight-line × 1.25 if the trip has no distance. The first trip of the month and trips without a vehicle do not count. Use Return loads to avoid empty kilometres.
Performance#
Performance is an overview per driver: Score, Trips, Km, On time, Check (departure checks), Signature at delivery, Consumption, Waiting time and Damage · fines. The score is indicative and meant to recognise good work and adjust in time, not as the only assessment. How the score is calculated explains the calculation.
CO₂ report#
CO₂ report estimates the emissions of your transports (well-to-wheel) based on distance, the vehicle's consumption and the CO₂ factor from the company settings. You see the Emissions per month (tonnes CO₂e) and per customer Trips, Km, kg CO₂e and g/tkm, with a Report per customer.
Summarise with INTEGALL AI#
If INTEGALL AI is on, Summarize with INTEGALL AI summarises a report's figures with the main points and risks. Only the aggregated figures on the screen are sent. See INTEGALL AI.